The Solar Corona
We don’t really know how long humans have noticed the spectacular corona of our sun, but it seems likely we have admired it for as long as humans have existed. The first western description of the corona during a total solar eclipse was probably that of Lucien in 932 BCE "… a kind of light is visible about the rim which keeps the shadow [of the moon] from being profound and absolute." Some ancient petroglyphs and other primitive art seem to suggest a sun disk with ‘protrusions’ of one kind or another, but we can’t be certain of this interpretation. Amazingly, we have no accurate sketches of the corona until perhaps as recently the May 25, 1751 eclipse, drawn by Cambridge Professor Roger Cotes from England.
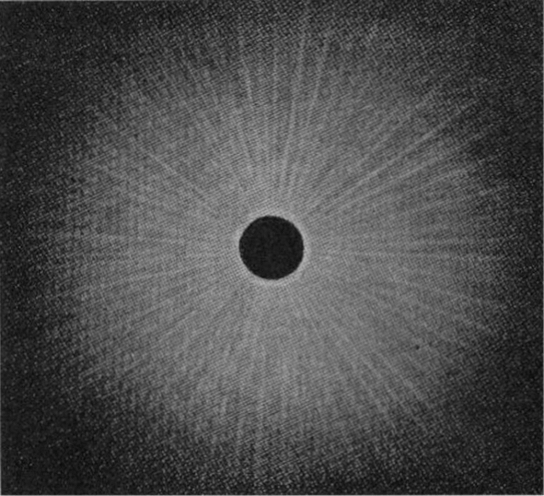 Figure 1-Cotes sketch of corona (1751)
By 1800, virtually all subsequent total solar eclipses were rendered either as detailed sketches, or after 1851 as actual photographs. Spanish astronomer José Joaquin de Ferrer, during the June 16, 1806 eclipse, even coined the term ‘corona’ to describe the ephemeral glow of light surrounding the eclipsed sun disk. This led him to the idea that the corona must belong to the Sun, not the Moon, because of its great size.
By 1868, sketches became more elaborate and detailed as artists and scientists alike learned what to look for. The drawing of the August 18, 1868 eclipse viewed from India by Major Tennant shows not only the corona but also the new solar feature called the ‘prominence’. As one popular book on astronomy from 1890 notes “It would be far better, however, if some other name such as "glowing clouds" or "red jets" could be used, for there is now no doubt that they are jets of gases, chiefly hydrogen, constantly playing over the face of the sun, though only seen when this brighter light is quenched.”
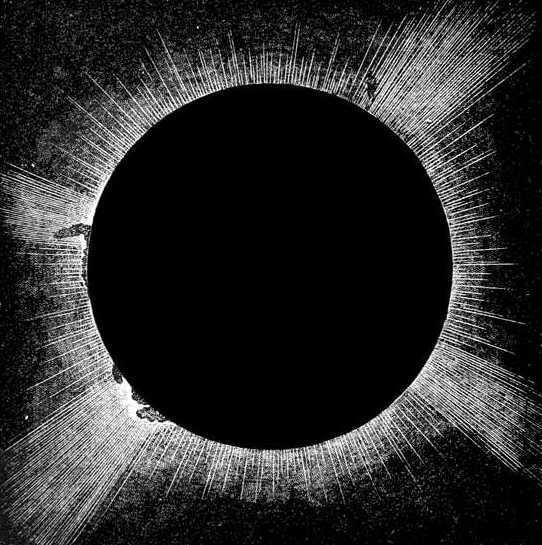 Figure 2 – Major Tennant’s sketch of 1868 eclipse showing prominences.
Around this same time, Samuel Heinrich Schwabe discovered that the number of sunspots countable on the solar surface increased and decreased with a roughly 11-year cycle. Astronomers soon wondered whether the shape and character of the solar corona also changed with such a cadence. French astronomer Pierre Jules César Janssen was one of the first to recognize this correlation as he compared the eclipses of 1871 and 1878: At sunspot maximum, the corona is rounder; at sunspot minimum, the corona is more elliptical.
Although Janssen considered coronal changes within a sunspot cycle, the studies of coronal shapes and their changes from one cycle to the next continued with Russian astronomer Alexi Ganskiy in 1897 and later in 1902 with Indian astronomer Kavasji Naegamvala. The research by Russian solar astronomer A. G. Tlatov at the Central Astronomical Observatory in Pulkovo in 1989 used drawings and photos of all eclipses since 1870 to quantify how the shape of the corona changed from sunspot cycle 12 to 24. There were, indeed, changes that spanned many sunspot cycles suggesting a 100-year cadence for large-scale coronal changes.
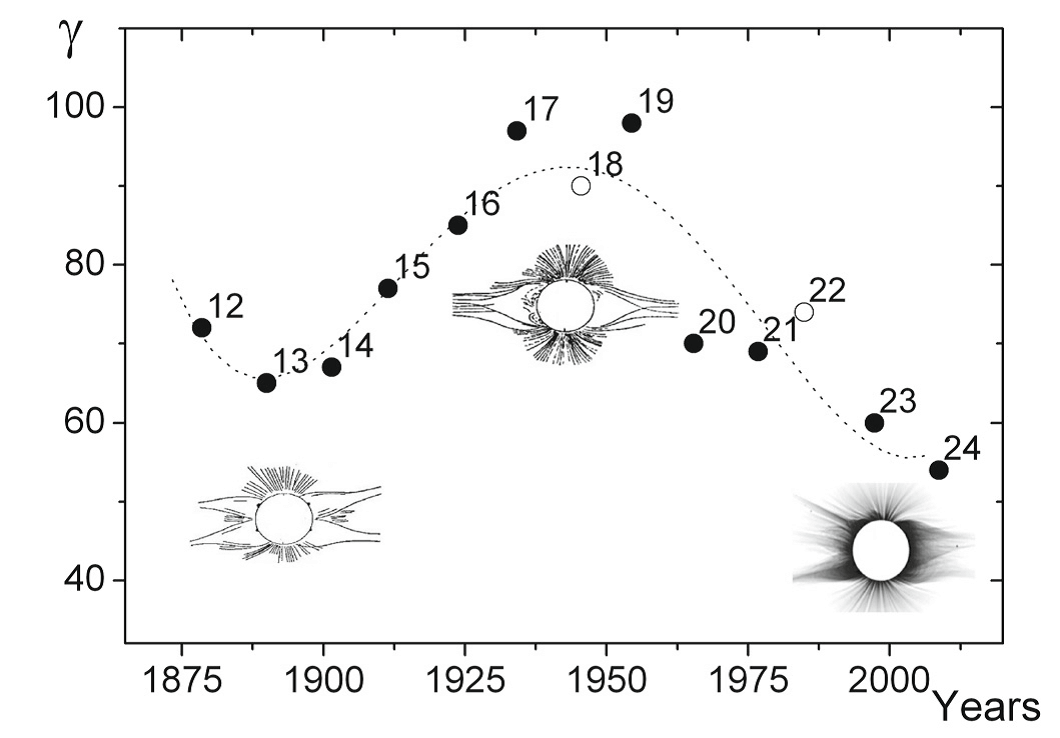 Figure 3 – Coronal shape changes 1870 to 2004 (Credit Tlatov: Astronomy &Astrophysics, 2010)
But why should the corona change its shape like this? To understand why, we need to discover what the corona actually is as a physical object. Those discoveries spanned a nearly 100-year period from the mid-1800s to the 1900’s as technology and our understanding of physics improved.
During the eclipse of 1879, Charles Young and William Harkness used a spectroscope to independently discover a new element the spectrum of the Sun's corona: coronium. Sixty years later, Bengt Edlin deduced that coronium was actually just the element iron seen under very high temperatures having lost 13 of its 26 electrons by the process of ionization. It would take temperatures near a million degrees Celsius to make iron atoms behave this way, which itself was a confounding discovery not to be explained until the late-1900s.
Throughout the first half of the 20th century, an enormous amount of new information was gathered using new technology, and also using detailed mathematical models based upon the infant subjects of plasma physics and quantum mechanics. The corona is a trillion times less dense than the photosphere, which defines the sharp disk of the sun that we see. At very high temperature (a few million kelvins) and at very low density (of the order of 1015 particles/m3) the corona is an example of the fourth state of matter called a plasma. This plasma was not, however, motionless. Coronal plasma was the basis for a vast wind from the sun spanning the solar system predicted not only from mathematical models created by Eugene Parker (who coined the term ‘solar wind’), but also observed in the tails of comets by Ludwig Biermann, and by direct measurement from spacecraft such as NASA’s Mariner 2 and the Soviet Luna 1. Meanwhile, astronomers continued to scratch their heads over the conundrum of how a star with a surface temperature of 6,000 Celsius could have an overlying corona with a temperature of several million Celsius! As it would turn out, the explanation for this mysterious heating also accounted for the shape of the corona itself: magnetism!
Astronomer Frank Bigelow had already noted in 1889 that the coronal streamers observed during the 1878 eclipse had a strong resemblance to magnetic lines of force, so he proposed the Sun must, in fact, be a large magnet. But there was as yet no way to measure magnetism on the sun. This changed in 1908 when George Ellery Hale discovered a way to at least detect the intense levels of magnetism in sunspots. Although Hale’s instruments could not detect the extremely weak magnetic fields in the corona, it was already known by then that the shape of the corona changed with the sunspot cycle, so there had to be some magnetic connection between sunspots and the corona. The shape of the corona is, in fact, determined by two magnetic components. There is a polar field that resembles a bar magnet, with lines of force that fan out into space above the solar north and south poles. There is also an equatorial field defined by prominent ‘helmet streamers’ where the lines of force begin and end in the equatorial zones.
 Figure 4 – Sketch of 1878 eclipse by Trouvelot
This figure shows the predicted magnetic field in the corona for Cycle 13 in 1889 (left) and Cycle 19 in 1954 (right). During Cycle 13, the sun’s magnetic field does indeed look like that of a bar magnet (called a dipole field) but as the sunspot cycles progress, the equatorial field splits into two pairs as the sun’s equatorial magnetic field becomes concentrated into two mid-latitude zones. Although the solar plasma is trapped on closed equatorial magnetic field lines, hence the brightness of the helmet streamers, the open field lines at the poles allow plasma to flow outwards from the solar surface.
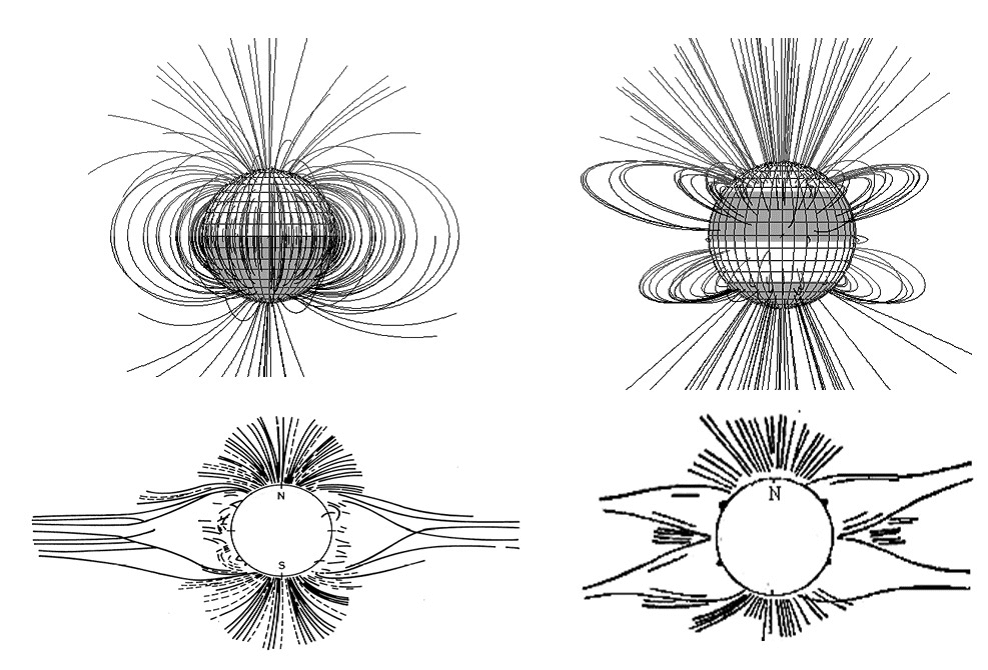 Figure 5 – Coronal changes (Credit Tlatov: Astronomy & Astrophysics, 2010)
Because of these open field lines, plasma in the outer edges of the corona is constantly flowing out into interplanetary space, and this is what creates the solar wind. Skylab astronauts in the 1970s also discovered that these open field lines, called ‘M-regions’ by solar physicist Sydney Chapman in 1940, appeared as ‘coronal holes’ that could form elsewhere on the sun. There was no plasma detected in these regions at temperatures above 100,000 Celsius so they appeared dark in the images such as this one obtained by NASA’s Solar Dynamics Observatory in 2016.
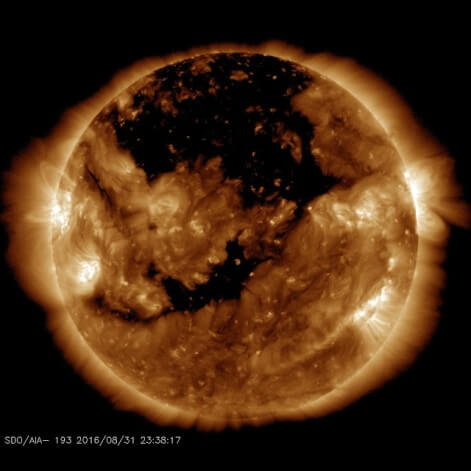 Figure 6 – Coronal holes seen in polar and equatorial regions of the sun (Credit NASA/SDO)
So when all of the information is pulled together, the shape of the corona is determined by magnetic activity on the solar surface and the ways in which the hot plasma interacts with these magnetic lines of force. We can now create beautiful images of the corona that show its detail and how the magnetic lines of force combine to give its spectacular shapes, along with their changes in time. Amazingly, even by 2017 there is no available technology to map the magnetic field in the corona at resolutions comparable to those details seen during a total solar eclipse!
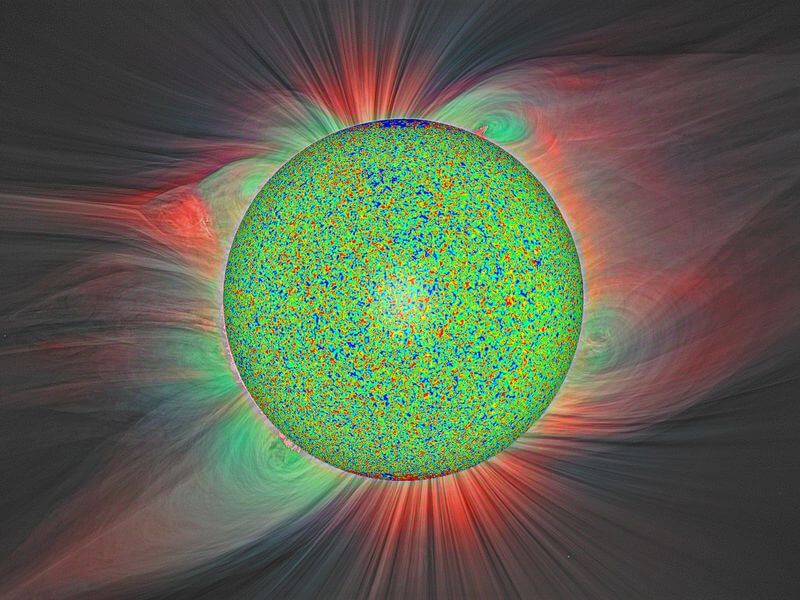 Figure 7 - A mosaic image showing magnetic activity in the corona ( Credit: Tahar Amari /Centre de physique théorique.CNRS-Ecole Polytechnique.France& Eclipse S.Habbal and M. DruckMuller)
From all of this information, can you sketch what do YOU think the corona might look like on August 21, 2017 when the sun is approaching sunspot minimum at the end of Cycle 24?
Resources:
- Lucien - https://sunearthday.nasa.gov/2006/locations/firstcorona.php
- Roger Cotes - http://adsabs.harvard.edu/full/1906Obs....29..104L
- Tlatov research - https://arxiv.org/ftp/arxiv/papers/0804/0804.1989.pdf