The Chromosphere
Normally, the brilliant surface of the sun, called the photosphere, is the most common feature we see, and even so its brightness masks many other important regions of the sun from easy view. But once you filter out the light from the photosphere, all other fainter regions vanish completely. Only during a total solar eclipse do we have the opportunity to fully appreciate all of the other solar details hidden by the photosphere’s brilliance.
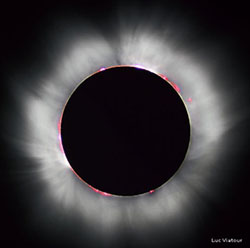
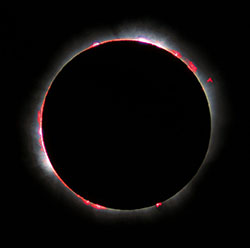
Above the photosphere and extending about 5,000 km above its turbulent surface, we find a region of the solar atmosphere called the chromosphere. It is only seen during total solar eclipses, or with sophisticated telescopes, and its red and pinkish color gives the blackened moon a thin halo of color against the greyish corona further out, hence its name ‘chromo’ sphere.
This spectacular image is the work of Luc Viatour (Luc Viatour / www.Lucnix.be) of the 1999 eclipse and plainly shows the chromosphere and some of its details.
Physically, the chromosphere begins near the surface of the photosphere with a temperature near 4700 Celsius and a density of 1017 particles/cm3 (2x10⁻⁴ kg/m3), and at its highest level reaches a temperature near 25,000 Celsius and a lower density of 1010 particles/cm3 (2x10-11 kg/m3). But rather than being just a homogenous shell of plasma, it resembles the troposphere of our own planet Earth with complex storms and other phenomena roiling its volume from minute to minute. The reason for this is that the magnetic fields formed at or below the surface of the photosphere are not confined to the solar surface, but extend through-out the chromosphere. Magnetic arcs, prominences and other carpets of magnetic activity repeatedly form and dissolve, releasing energy and stirring up the chromospheric plasma. Solar physicists call the chromosphere and the narrow region above it the solar ‘interface region’. It is a complex zone of plasma and magnetic field, which transmits matter and energy between the photosphere and the corona. A sketch of the many phenomena operating there is shown in this figure:
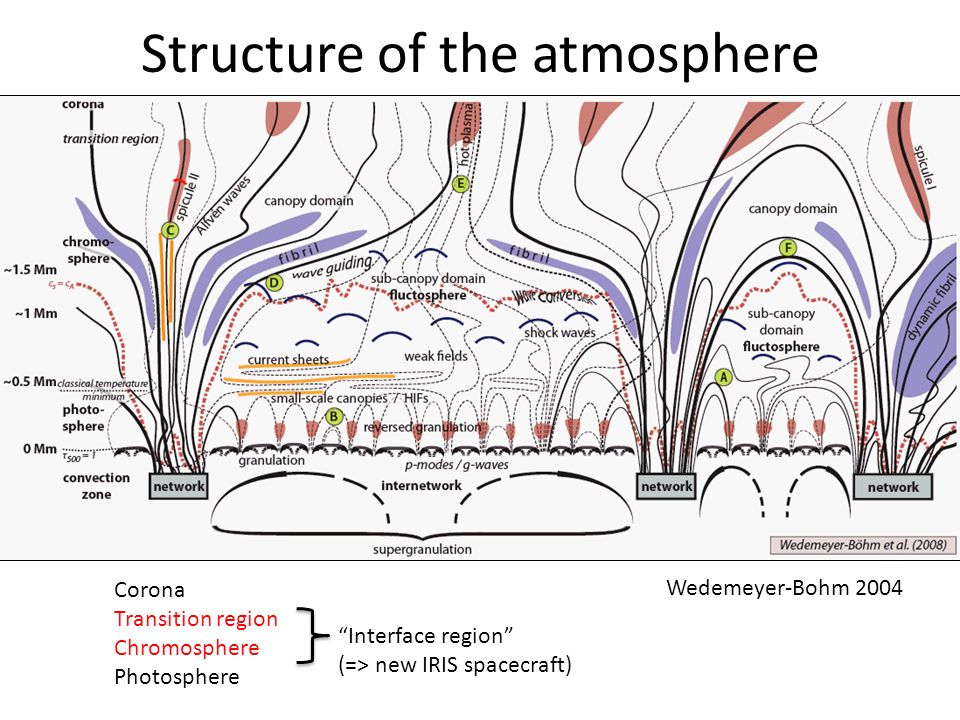
The figure shows the solar surface (photosphere) located at 0 kilometers (In the figure this is noted as 0 Megameters: 0 Mm) and the mini-magnetic loops created there by the solar granulation convection. The tops of these small loops reconnect together to form a more tangled magnetic field, and release energy to heat the local plasma. This also creates shock waves that travel outwards towards the base of the corona and heat the plasma to 100,000 Celsius and higher. This process also generates magnetic disturbances called Alfven waves that travel along magnetic field lines and further heat the coronal plasma.
The NASA, IRIS solar observatory, launched in 2013 has instruments specifically designed to study the temperature, density and mass flows in this important solar region, and at a resolution high enough to see features only 200 km across! An example of such images is shown here of a portion of the chromosphere with numerous vertical filaments and other structure, compared to a mathematical model of what the magnetic fields and plasma might be doing under similar conditions.
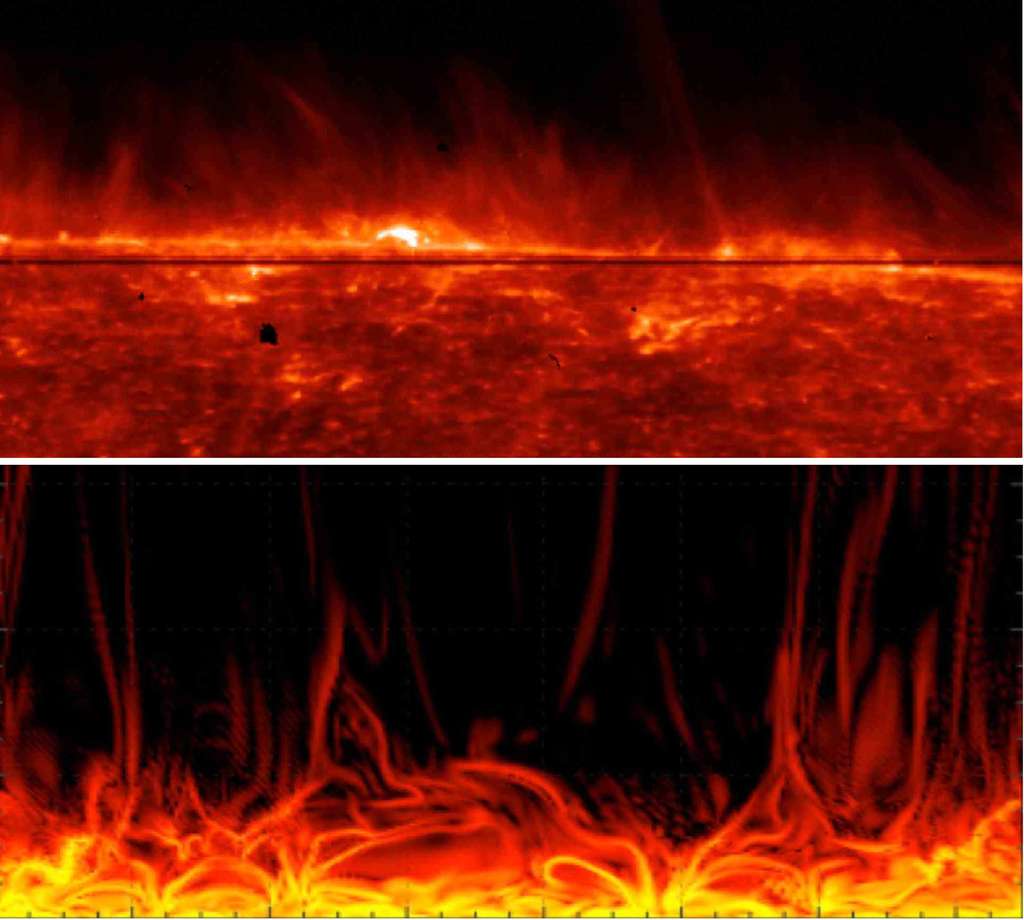
Figure showing (top) actual IRIS image of chromosphere structure above the photosphere and (bottom) a plasma physics simulation of magnetic fields and plasma created by the convecting photospheric surface. (Credit: Tahar Amari, Jean-François Luciani et Jean-Jacques Aly du Centre de physique théorique (CNRS/École Polytechnique) et du Service d'Astrophysique-Laboratoire AIM (CNRS/CEA/Université Paris Diderot) http://www.futura-sciences.com/sciences/actualites/soleil-enigme-chauffage-couronne-solaire-enfin-resolue-58585/
Among the bestiary of new phenomena detected by IRIS are heat bombs, mini-tornadoes, high-speed jets and nanoflares – all driven by magnetic fields and plasma interactions and capable of transporting energy through the chromosphere and into the corona. https://www.nasa.gov/content/goddard/iris-helps-explain-heating-of-solar-atmosphere
Astronomers used to call them solar spicules. A spicule is a dynamic plasma jet of about 500 km diameter that moves upwards at about 20 km/s from the photosphere. They were discovered in 1877 by Father Angelo Secchi of the Observatory of Roman Collegium in Rome. They last for about 15 minutes and carry about 100 times the mass density per second as the solar wind. About 60,000 of these pepper the entire surface of the sun just above the photosphere and can reach a maximum height of 10,000 km at the top of the chromosphere. Amazingly, we still do not have a good explanation for this important chromospheric phenomenon!
Here is an image obtained by the Hinode spacecraft of a hedgerow of spicules along the solar limb.
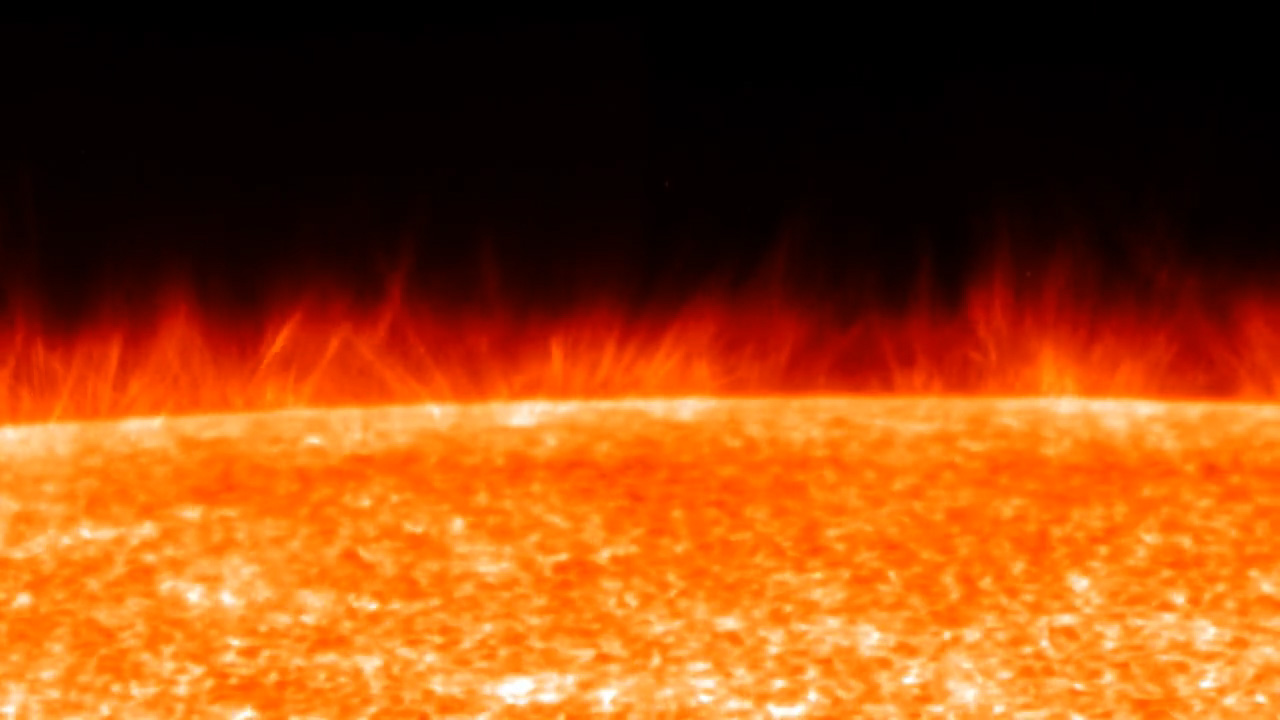
Credit: Scott McIntosh, Bart De Pontieu, Viggo Hansteen and Karel Schrijver/UCAR.
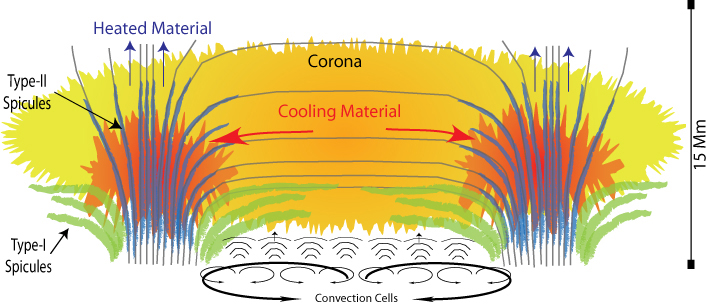
In this diagram spanning 15,000 km in height above the photosphere, high speed upflows seen in the upper chromosphere as Type-II spicules get thrust into the corona. This material is visible at a wide range of temperatures, and some of it becomes trapped in the coronal magnetic field. Later, this material falls out along the same magnetic field lines, most likely as a phenomena called "coronal rain."(Credit: Scott McIntosh, Bart De Pontieu, Viggo Hansteen and Karel Schrijver/UCAR).
Why does the chromosphere shine so brightly in the color red? Composed mostly of hydrogen, under these temperature conditions, the most common way that hydrogen gases shine is through the emission of a particular spectral line called hydrogen-alpha or Ha at a wavelength of 656.3 nanometers (6563 Angstroms). Specifically it is from a quantum transition between the N=3 and N=2 energy levels of the hydrogen atom and is the principle atomic line in the so-called Balmer series of transitions. This light, when generated, shines with a distinct red color, giving the chromosphere its characteristic color. But why is this particular emission line of the dozens of other hydrogen lines the one that gives the chromosphere its color?
The intensity of the various hydrogen emission lines is a complicated balance between the density of the hydrogen and the local temperature. Because the density drops by a factor of 10 million between the bottom and top of the chromosphere, and the temperature increases by a factor of 5 over the same 10,000 km height range, models of how hydrogen atoms are excited to produce the various possible emission lines are very sensitive to height above the photosphere. Detailed, 3D radiation calculations suggest that most of this Ha emission is produced in a narrow zone between 500 km and 1,500 km of the solar surface where the temperature and density conditions are ideal.
Note for hydrogen atoms at a temperature of 10,000 Celsius, the average speed of the atoms is only 13 km/sec and well below the escape speed for the solar surface of 618 km/sec, so even at these high temperatures, the atmosphere of the sun inside the chromosphere is trapped by the solar gravity.
So, what you see from Earth during a total solar eclipse is only a small sliver of the solar chromosphere. In fact, the 10,000 km width of this region would subtend an angle of only 13 arcseconds as viewed from Earth’s surface. In comparison, some of the deeper valleys along the moon’s limb are about 10 km deep and subtend an angle of 6 arcseconds. What this means is that even during the most ideal total solar eclipse, the chromosphere is generally blocked out entirely, or only glimpsed briefly as the light from this region passes through some of the deeper lunar canyons.
An interesting way to study this region astronomically is by using a spectroscope. Normally, a spectroscope has a small slit to make the observed lines as narrow and ‘focussed’ as possible, but because the chromosphere is so narrow, during a total solar eclipse the limb of the moon provides a natural slit for the spectroscope. What ensues is called a ‘flash spectrum’ that often reveals important details about the solar chromosphere ‘on the fly’ as totality progresses. Amateur astronomers can place a diffraction grating in front of their camera to capture this unique spectrum. Here is an example of such a spectrum (Credit: Constantine Emmanouilidi conemmil@gmail.com)
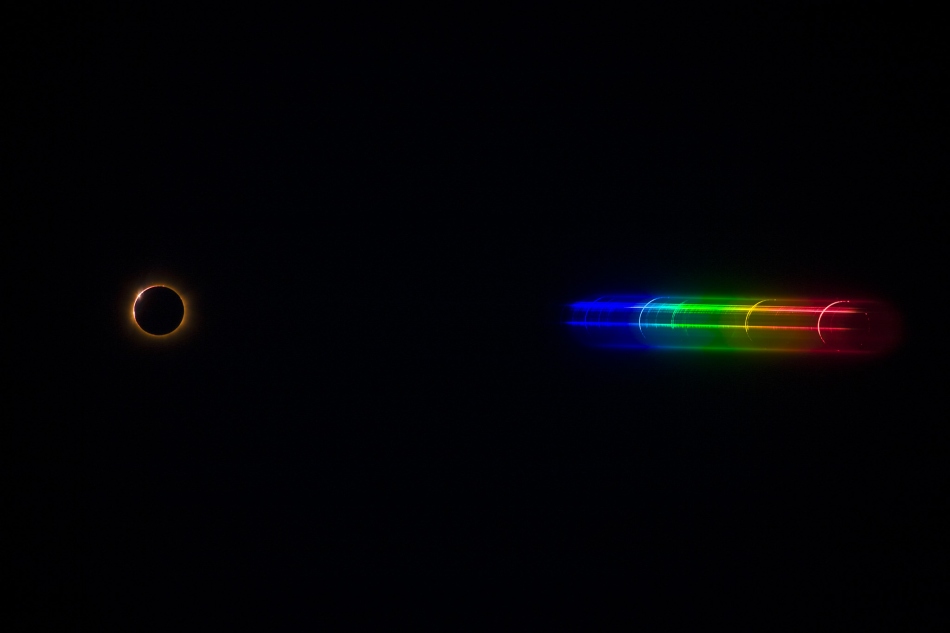
The most intense line is to the far-right from Ha and the yellow line is produced by the second most abundant solar gas, helium, first discovered in the sun in the 1800s. The intensity of the light along each curved line follows the curve of the limb of the sun that remains exposed by the moon.