The Origin of the Corona’s Light
One of the most beautiful things about viewing the solar corona during a total solar eclipse is the light from the corona itself. Why is it that the corona shines with such a unique color and texture? Here we see an image of the 1999 eclipse taken by photographer Luc Viatour ( Luc Viatour / www.Lucnix.be)
Observers variously describe the color as a milky white, greenish-white, bluish-white, or reddish-white. The details depend on observing locations, atmospheric effects and the acuity of the human eye itself, which vary from person to person.

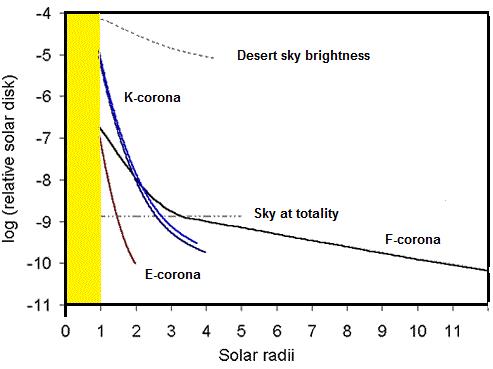
We know that the sun shines because its surface has a temperature of 6000 Celsius. Such surfaces emit electromagnetic radiation in the visible part of the spectrum near what the human eye and brain identify as the color yellow. But how does the corona shine? In fact, there isn’t simply one corona emitting light but five different solar corona, each produced by different light-emitting processes. To distinguish them they are called the K-corona, E-corona, F-corona, T-corona and the S-corona after ‘Kontinuierlich’ (Continuum), Emission, Fraunhofer, Thermal and Sublimation. The figure shows then brightness of the major K, F and E corona components in terms of their distance from the sun in units of the sun’s radius, and the intensity of the corona in terms of the brightness of the sun’s photosphere. Also is the brightness of the clear desert sky, and the sky during a total solar eclipse. Even during a total solar eclipse, we see that the K-corona outshines the F an E coronas at distances closer than about twice the solar radius, but at greater distances it is the F-corona that completely dominates. The E-corona is the weakest of the three within twice the sun’s radius and is generally not observable except by using a spectroscope, but more on that later. To understand these regions, we have to understand how matter and radiation interact.
The E-corona
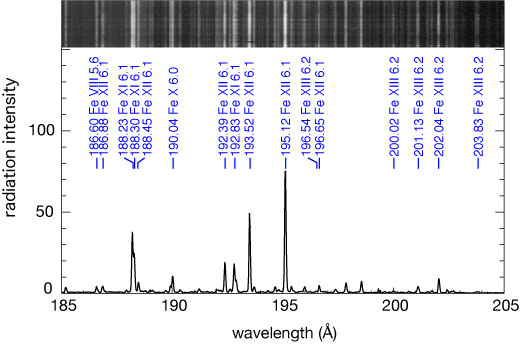
The corona is a dilute ‘upper atmosphere’ to the sun in which atoms become ionized at temperatures above 1 million Celsius. Although hydrogen is completely ionized into free protons and electrons, other common elements such as oxygen, nitrogen and iron are not completely stripped of all their electrons. This means that the coronal gas is a high-temperature plasma consisting of numerous free electrons and the ions of many kinds of atoms. The E-corona represents the light from ions in this plasma that absorb light from the photosphere and re-emit it through specific electronic transitions between energy levels in these ions. Because no two atoms and ions have exactly the same set of electronic transitions, each ion emits a unique pattern of spectral lines, which can be detected with a spectroscope. Based upon these lines, astronomers can identify which elements are present in the coronal gas, the temperature of this particular ionic species, how fast clouds and other structures are moving, and the density of this gas. With suitable instruments, they can even be used to measure the strength of the magnetic fields through which they move. The E-corona only extends about 700,000 km from the photosphere, but this region includes the majority of the bright corona that you see during a total solar eclipse. It is also, and fortunately, the region from which we can obtain the most detail about the detailed properties of the corona using spectroscopic techniques. For instance, this portion of the corona’s ultraviolet spectrum was obtained by the Hinode EIS instrument and shows numerous spectral lines of the element iron. The Fe XIII lines are produced by an ion of iron in which 12 of its 26 electrons have been removed.
The first spectral line from the corona was actually detected in 1869 by Charles Young and William Harkness, soon after the new technology of the spectroscope had been applied to astronomical objects. The intense green line appeared at a wavelength of 530.3 nm, and because it did not match known elements was called coronium. It wasn’t until the detailed work by Walter Grotrain and Bengt Edlin in the 1930’s that it was correctly identified with the iron ion called FeXIII. Other lines from calcium ions were also eventually detected and identified.
The K-corona
With all those free electrons in the corona, a second form of light emission can take place. Photons of light emitted by the photosphere can interact with these electrons causing the photons to be scattered in different directions. This is a process called Thomson scattering by physicists, and because of this process and the huge number of photons leaving the photosphere every second, we can see the entire extent of this electron-plasma cloud out to 2 million kilometers from the photosphere. This is called the Kontinuierlich (German for ‘Continuum’) or K-corona because it emits a continuum of light frequencies, unlike the E-corona which only emits light at the specific frequencies of the ions it contains. When you look at this coronal light with a spectroscope you do not see individual spectral lines but only a uniform wash of optical light at a wide range of frequencies. Near the photosphere, the density of electrons is about 400 million per cubic centimeter, but by a distance of 3 solar radii (2 million km) it has dropped to only 400,000 per cubic centimeter, which explains the dramatic fading of the K-corona with distance by a factor of nearly 50,000 in intensity.
The F-corona
This was initially thought to be a mysterious feature of the corona because even though the E-corona revealed a temperature of millions of degrees for the corona, beyond a distance of about 2 solar radii (700,000 km) these hot ions became undetectable and a seemingly new gas population appeared. This ‘new’ coronal gas had virtually the same spectral lines as the solar photosphere observed by Fraunhofer, hence the name F-corona. What was seen were absorption lines from cool gas produced by ions of hydrogen (HI: 121.6 nm), carbon (CIII: 97.7 nm) and silicon (SiIII: 120.3 nm) in the ultraviolet, and calcium and other elements in the visible ‘Fraunhofer’ spectrum. Basically, the F-corona looks like a mirror of the photosphere situated some 1 million km above the solar surface. By the 1960’s, after extensive studies of the F-corona at infrared wavelengths, astronomers determined that this region was populated by interplanetary dust grains falling into the sun! The sunlight carrying the photospheric spectrum of the sun would reflect off these dust grains without altering the visible and ultraviolet properties of this light. In the infrared, however, the small dust grains did not act like perfect mirrors, and this is what made it easy to distinguish the F-corona from the K-corona.

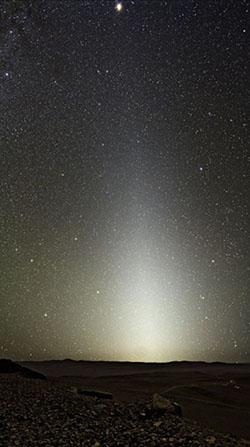
The F-corona has been detected to distances of 7 solar radii or nearly 5 million kilometers. The most common way to detect and map the F-corona is by using telescopes equipped with infrared filters during total solar eclipses. Observations at 2.2-microns were performed during the 1998 total solar eclipse and showed that the F-corona was slightly flattened but its brightness declined as nearly the inverse-square of the distance out to about 8 solar radii (6 million km), and the tilt is similar to the ecliptic plane through which the zodiacal dust has the highest density. The space distribution of the dust grains seems to follow a 1/r – law. This figure is a compilation of ground-based, balloon and satellite measurements of the solar corona and the interplanetary Zodiacal dust band by astronomers Hiroshi Kimura and Ingrid Mann in 1998. The K-corona provides most of the coronal brightness between 1 and 4 solar radii, but the F-corona then smoothly takes over until it joins up with the Zodical light at about 80 solar radii at about 20 degrees from the center of the sun.
In 2018, the Solar Probe Plus probe will be launched and pass within 6 million kilometers of the sun, and among its many goals will be so study the dusty plasma of the F-corona during its encounter in December 2024. The SWEAP instrument, developed by the Smithsonian Astrophysical Observatory will measure electrons, protons and other charged particles, while the Fields Experiment will count the number of dust grains the spacecraft encounters. During a total solar eclipse, only the corona within about 2 solar radii of the center of the sun is visible to the eye, and this part of the corona is entirely produced by the light from the K-corona, with a variety of features such as polar plumes, helmet streamers and coronal mass ejections superposed.
The T-corona
As the interplanetary dust grains are heated by proximity to the sun, they emit their own ‘heat’ energy, which is directly detected in the F-corona at infrared wavelengths. Although the F-corona is detected by the sunlight that the dust grains reflect, the T or ‘Thermal’ corona emits its own light, which can be used to directly measure grain temperatures an even the sizes and shapes of the grains themselves. These grains seem to have sizes between 1 to 100 microns.
The S-corona
Calculations show that silicate-rich dust grains will reach their evaporation temperatures at about two solar radii (700,000 km) and that dust grains rich in carbonaceous material like graphite will survive to about four solar radii, while olivine-rich dust grains will start to sublimate at about 10 solar radii ( 7 million km). o, between 3 and 10 solar radii, interplanetary dust grains will evaporate and the brightness of the F-corona or T-corona should show a ‘dip’ where this happens. This sublimation zone was possibly detected directly by astronomer Y.Y. Shopov at the University of Sofia in Bulgaria who studied the singly-ionized calcium line (393.4 nm) observed in emission, which means there is considerable cool calcium present, and as he proposed, possibly from the material evaporating from the calcium-rich dust grains.